This is one of the short reels from Sunset Park Elementary School circa 1967. It depicts the Patrol Picnic, an outdoor picnic lunch put on by the teachers for the students.
Footage of Lakeshore Drive and the Museum Campus circa 1937, filmed by Albert Roderick of Mount Prospect. This clip has been edited and isolated down from the original 8 minute video.
Footage from downtown Mount Prospect from the late 1930s. The footage was shot by resident Albert Roderick and shows local businesses and the train station. This clip was edited from a longer piece of digitized film.
This week, my main priority was making sure I finished digitizing the first batch of tapes from Sunset Elementary School. These were the shortest tapes to work with and I figured would be good practice before digitizing some of the older, larger tapes. I came into the library more often than usual this week to make sure I finished. Also, the research department staff don’t even need to ask what I need when I approach the desk, they just start setting up the digitizer now. I digitized four more tapes this week. Some were completely new videos. One was a video of gym class where kids were doing a gymnastics/tumbling unit. Other videos were just continuations of other videos I had already digitized. I got more footage of a Halloween parade and more footage of the band class from my very first tape. Emily and I have discussed the possibility of using the newly digitized footage in a social media post. All in all, I successfully digitized all the tapes from the Sunset collection and can now move on to some of the larger tapes. These ones belong to a mysterious ‘Fred Rogers’ and are from the 1930s. Some of them are degrading and we’re probably going to send them out, but there are a few that should be stable enough
I also delved a little deeper into the roller derby rabbit hole, diving more into the gender dynamics of the sport, especially since it was a sport where men and women competed on equal footing. I found an oral history project with interviews from some of the female skaters, some of who had been teammates with the main subject of my research, Sammy Skobel. They spoke about the relationship they had with the male skaters, usually something akin to a sibling dynamic. One huge part of this research project has been combing fan sites as that is a huge part of how roller derby history has been preserved. On some of these sites, I found interviews with skaters and short online memoirs. One of these sites was run by Loretta Behrens, one of the female skater. Sammy had been one of her favorite skaters and she eventually found herself on the same team as him. They had a both a rivalry and respect for each other. Loretta also explained how a lot of the male skaters would look out for their female teammates, which also goes along with what Sammy has said in interviews. Even though the main focus of the exhibit is Sammy Skobel, I still plan on finding ways to highlight the experiences of the female skaters, and this angle may be something worth including.
In terms of planning for my exhibit, I have a pretty solid outline for what I’d like to include in the exhibit. I plan to start writing the text but not before I turn my attention to a potential exhibit space.
This week, I continued my research into Sammy Skobel and building a solid timeline of his life and career by cross referencing newspapers, items in the Historical society collection, and his autobiography. I’ve also been researching some of his fellow skaters and their stories to get a better idea of what the roller derby scene was like in the 1950s. Through this line of inquiry, I’ve been able to find out more about Sammy. One roller derby program I found references his dedicated fan clubs and when researching female skaters I found an Oscar nominated short film he took part in. My working idea is to have two parts of the exhibit, one dealing with the history of roller derby and Sammy’s contributions to it and the other focused more on Sammy’s achievements as a citizen of Mount Prospect.
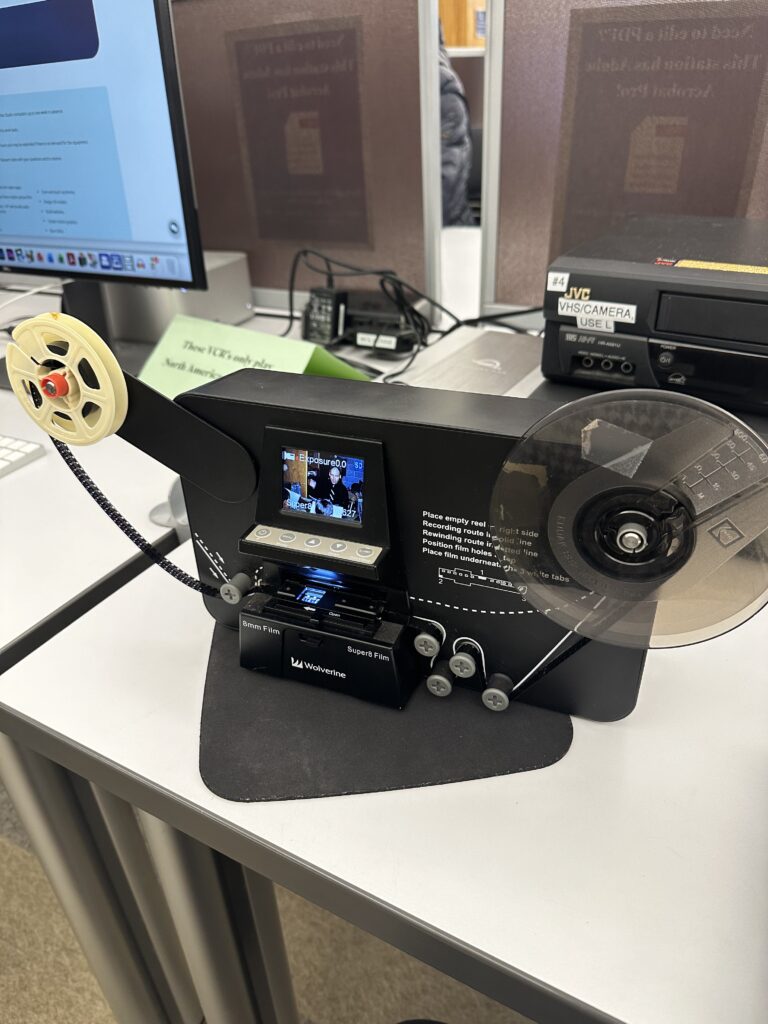
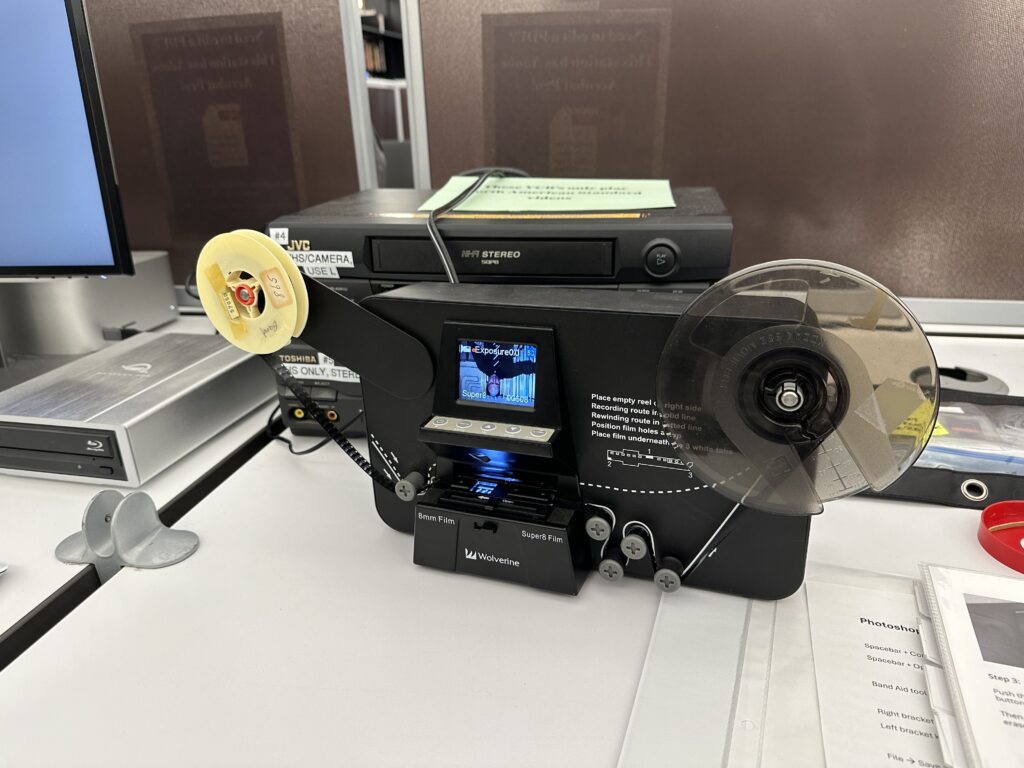
I’ve digitized several more Super 8 tapes and I’ve gotten very good at it. I’ve digitized two more tapes, the most recent being videos of a elementary school Christmas program and an outdoor school picnic. So far I’ve digitized 4 tapes total. Below is one my most recent captures, the Patrol Picnic. You can really tell this clip is from the 60s based on the fashion alone!
I also got to meet one of the board members and get a feel of what the relationship is between historical society employees and the board. Turns out, it can be hard to get things across to the board because of the disconnect that comes from lack historical training. Additionally, we’ve had a lot of technology problems, with the upstairs computers shutting down due to age. It can be difficult to convince the board to permit money to go towards technology, as the employees have been requesting new computers for a few years now. Sometimes it has to take something serious (like a computer breaking) to prove that a cost is necessary. Otherwise, I’m becoming much more bedded in at the historical society!
Tuesday marked the first day of my internship at the Mount Prospect Historical Society. My first hour was dedicated to getting introduced to my fellow coworkers by Emily, the director of MPHS and my supervisor for this internship. I also got a brief tour of the historical society, which is in the Dietrich Fredericks House, a historical house built by one of the first families to live in Mount Prospect. After the tour, I was shown my workspace, a cozy desk tucked under the staircase in the basement of the house.
The rest of the day was dedicated to familiarizing myself with the collection and thinking about what topic I may want to explore more for an exhibit in the museum. I spent a good portion of the day familiarizing myself with the collection on PastPerfect, the historical society’s collection management software. It has a dated UI and was very slow, so it was a little hard to navigate, but I was able to get a feel of what is in the MPHS collection. I was also able to to access the MPHS Google Drive, where there were many digitized papers and photographs.
Based on Emily’s advice and what was available in the collection, I decided to do research on Sammy Skobel, a local Mount Prospect hero. Sammy was famous in Mount Prospect for his hot dog restaurant but before that, he had risen to fame as a championship roller derby skater. Skating from 1945 to 1965, Sammy was one of the most revered skaters in the league winning MVP 3 times. Oh, and he was also blind, with only 10% of his vision. He also created a foundation for blind skiers, providing funding for guided skiing trips and introducing blind people to guided skiing. There’s a lot of materials related to Sammy in the collection including his skates and trophies. I spent most of the day looking through his file and the paper materials associated with him, mainly newspaper articles and photographs.
On Wednesday, I didn’t report to the historical society but instead continued my internship at the Mount Prospect Public Library. I work there in the circulation department, so after I clocked out at 4, I went upstairs to the computer studio where they have a film digitizer. Emily had given me a few short 8mm tapes to start with. After the staff got the device set up, I was on my own. I was able to figure out how to thread the film through the machine and was able to record the entire film strip. Even though the final product was two minutes long, it took about 25 minutes to digitize! The film was footage from an elementary school band class, circa 1968. While the final product was crisp and clear, it was also backwards, reversed and flipped upside down, the last person to use the film had put it back on the reel wrong. Even so, I was proud of my first digitization effort.
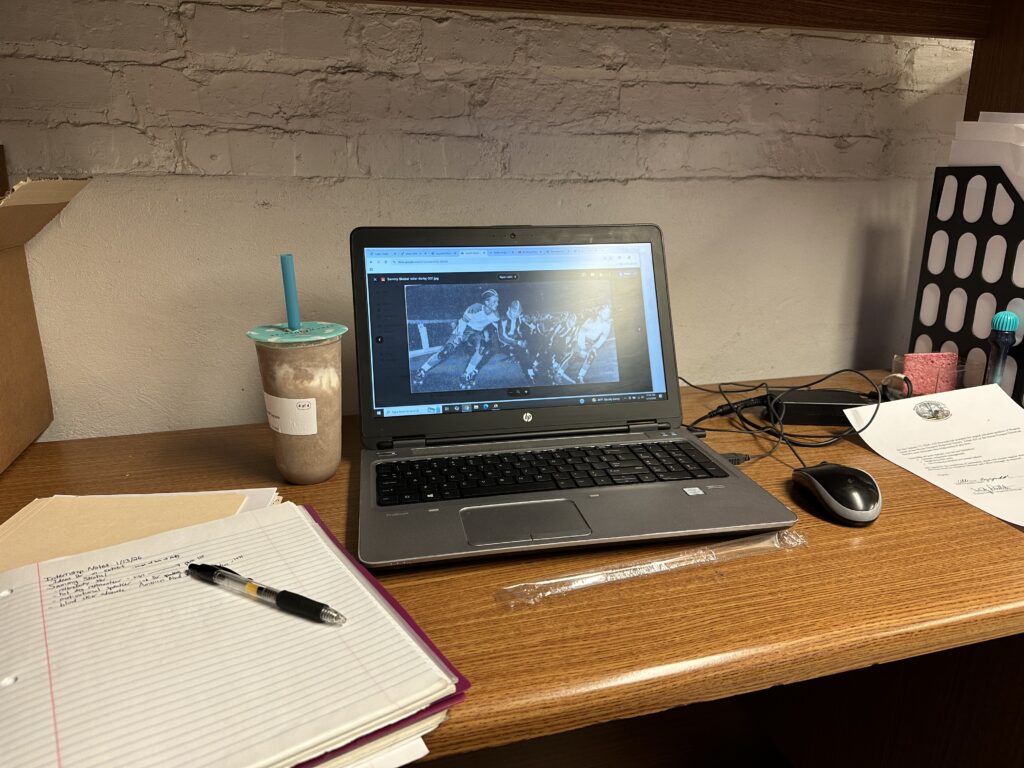
On Thursday I was back at the historical society. Since Emily knew I was looking into Sammy Skobel, she pulled his autobiography from the collection for me to look at. It proved a valuable resource. Using the book and the newspaper articles, I was able to begin to build a timeline as well as pulling key facts and stories from Sammy’s life. It also got me thinking of what materials would best work in an exhibit. I was also able to do some background research in the sport of roller derby since it’s so important to Sammy’s life and career. Roller derby was started in Chicago and by the time Sammy joined in the 40s was an organized sport. The sport was surprisingly equal for its time with men and women competing on the same team on equal footing. The women would usually skate in the first round and then the men would tag in. The men and women would skate for four rounds each, with all rounds counting towards the final score. Roller derby was a rough sport, with crashes and physical contact the norm. I was able to find a few videos of Sammy skating in roller derby circa 1952. At this time he was part of the New York City Chiefs and was number 23. ]These videos really highlight the high contact nature of the sport. It gives me an extra appreciation for Sammy knowing that he was able to compete while only able to make out vague shapes and light.
On Friday, I was back at the library digitizing. I rewound the band class film and was able to reorient the film to be right side up and actually start from the beginning. It was a perfect take. I also managed to get another film digitized, this one was footage from a local Halloween parade, also circa 1968. Overall, a productive first week!
For my Tool Takeover, I decided to create a history of Formula One through its circuits using StoryMap JS.
This idea came from my final project in Dr. Gorn’s Public History as Writing Class from last semester. One of my personal interests is in Formula One and I wanted to explore the history of the sport. I wrote an article intended for a more casual audience about the Formula One drivers union, the Grand Prix Drivers Association or the GPDA for short. Several of the races and events I mention in the map I originally wrote about in my article. These were the 1966 Belgian Grand Prix, the 1976 German Grand Prix, the 1982 South African Grand Prix, the 1994 San Marino Grand Prix, the 2014 Japanese Grand Prix, and the 2022 Saudi Arabian Grand Prix.
I see this map as a bit of an extension of that. Location has always been an important part of F1 history, especially how the sport is influenced by the politics of the places it travels to.
Another reason for undertaking this project is because I would love some more historical examination of the sport. The FIA, the governing body of the sport is working on digitizing its archives which would provide some amazing primary sources for studying this type of history. Unfortunately, it doesn’t look like the archive will be available anytime soon, as the website says the digital library will be public in 2024. It’s the end of 2025 and there’s only a beta version only accessible to club members.
To build this project, I went back to my GPDA article I wrote for Dr. Gorn’s class and added the locations in order. I then added a few races and tracks that I felt added to the history of the sport. This way, I could present a narrative about how the sport has changed over time in regards to safety and what countries the championship travels to. I relied primarily on the narrative text function, the images and videos were to add visuals, but I think it’s a good way to implement primary sources.
The thing about StoryMap is that it requires a very clear cut narrative and it’s harder for people to explore the map on their own. For me personally, I like to do some of my own digging and poking around on the map and look for what interests me the most.
I feel ok with my project. I neither love nor hate it. I like the platform for the most part, I think it’s an interesting way of presenting historical narratives. If I were to continue this project, I think it would be interesting to try and trace the narrative over an entire season. I could talk more about why races are hosted in specific countries as well as tell a clear narrative with clear geographical points. Or I could expand further by adding more places. For example, I could try having a story for every country that has hosted a race and go into the history behind why. Location is so important to a lot of F1 history, and I think a map based tool is a good way to illustrate this history.
I also wish there was a better way to visualize change over time. I feel like adding a timeline feature could be helpful where a user can scroll and see what races were on the calendar in the 1950s versus the 2020s. The 1950s would show most races were concentrated in Europe while a map from the 2020s would show a much more global championship. Instead, you just see all of the points on the map at the first slide of the project where it doesn’t really capture the full picture of how the sport has changed over time.
Overall, I liked using the StoryMap platform even though I’m not entirely satisfied with the project. I see the potential to do more with it in the future, perhaps.
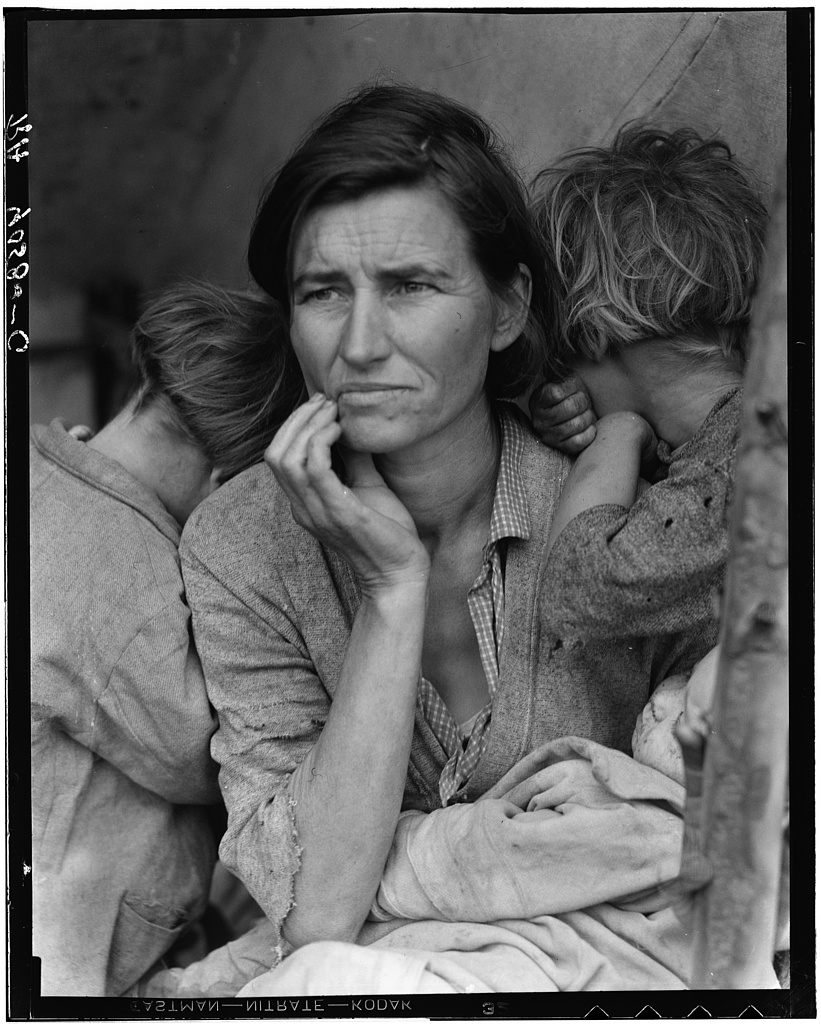
Photogrammar is an online digital visualization platform for the Farm Security Administration Office of War Information Photograph Collection. During the Great Depression the FWA hired photographers to roam the country taking photographs, hoping that these images could be used to garner support for the New Deal. As the project wore on, it eventually became a project to document the American experience. In total, over 170,000 photos were taken and collected in the Library of Congress. Photogrammer allows over 117,000 of these images to be easily accessible and searchable in a way that helps visualize the impact the Great Depression had across the nation by incorporating digital mapping. The site launched in 2012, was updated in 2014, and the current version of the site launched in 2021 with added historical context and a new interface. The site is housed by the University of Richmond and maintained by its Digital Scholarship Lab and Distant Viewing Lab with a team led by director Lauren Tilton.
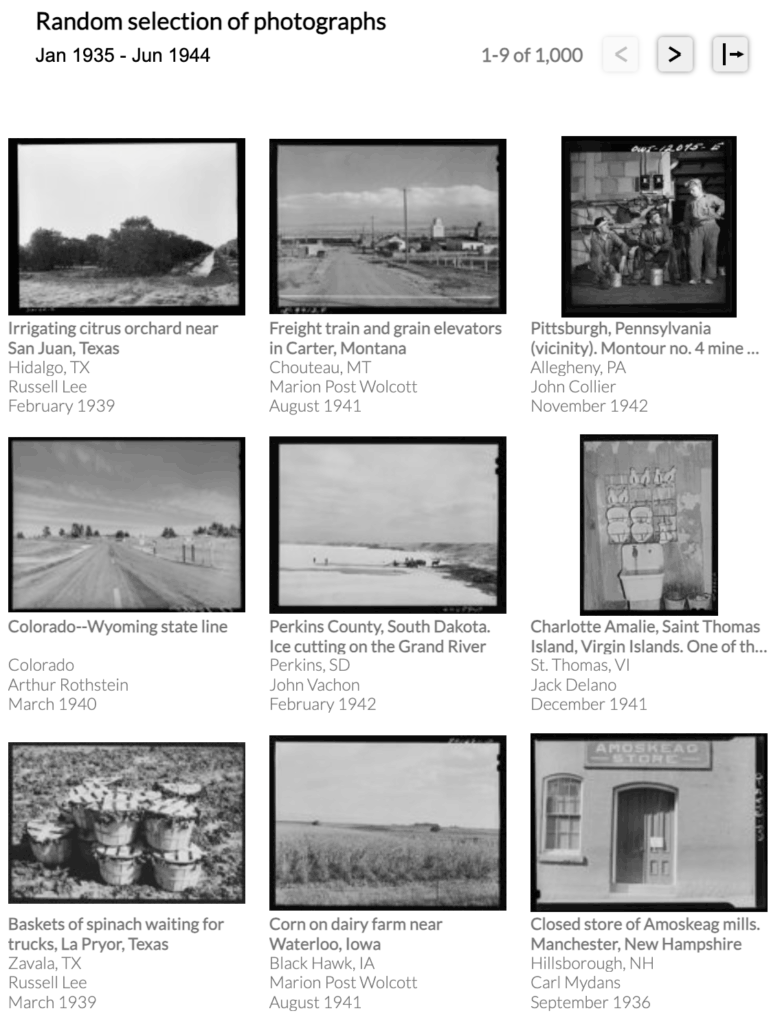
The landing page’s photo archive
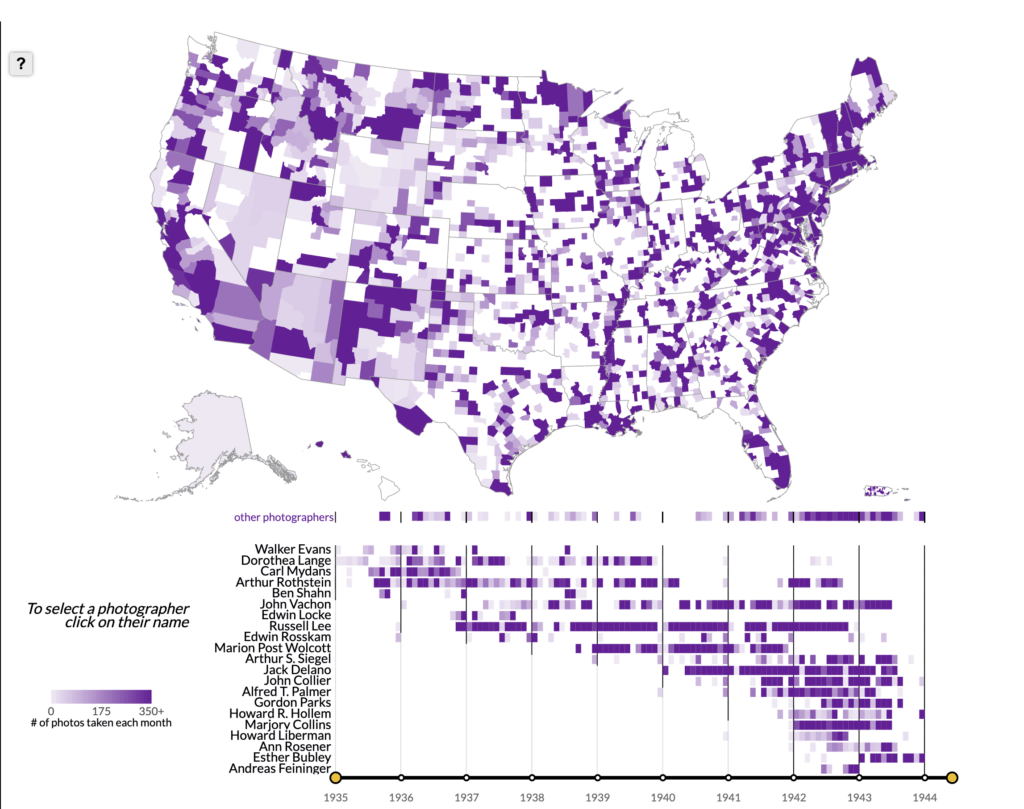
The landing page interface is clean and simple. The photo archive is on the left of the screen and displays photos in a 3×3 grid. The landing page features a selection of 1,000 random. The website also allows the users to adjust the display so that the photo archive display can take up more room than the map. The right side of the screen is taken up by the map and the timeline below that. Clicking on a state or county shows reveals the photographs taken within it in the photo archive on the left, as well as which photographers were active in the state and when. Below the map, there is a timeline with the year 1935 – 1944 along the x axis and a list of photographers forming the y axis. This timeline allows users to adjust the map so it can show where photographs were taken in certain years. Clicking on a photographer’s name changes the map the show where the photographer took pictures. Alternatively, users can search by city rather than county, with green circles illustrating photo density, though this is less reliable than the county map. Users can also a search the collection through a theme page.
The Photogrammar map and timeline
Once an image is found, clicking on the image takes users to a page that displays a larger photo along with the relevant metadata and a link to its Library of Congress entry. Below this, the site suggests further similar images, thus allowing another avenue for discovery and takes advantage of more modern digital trends.
Considering its scope, the project provides only a little historical context about the project. A short introduction page explains the origins and purpose of the FWA-OWI photography project. Instead, the designers of the website allows the sheer size and scope of the collection and the subjects of the photographs to speak for itself. Additionally, there are short biographies of many of the photographers associated with the project. I was delighted to find out that some of these biographies come with a recorded oral history of their time working as a photographer, giving more depth and dimension to this collection.
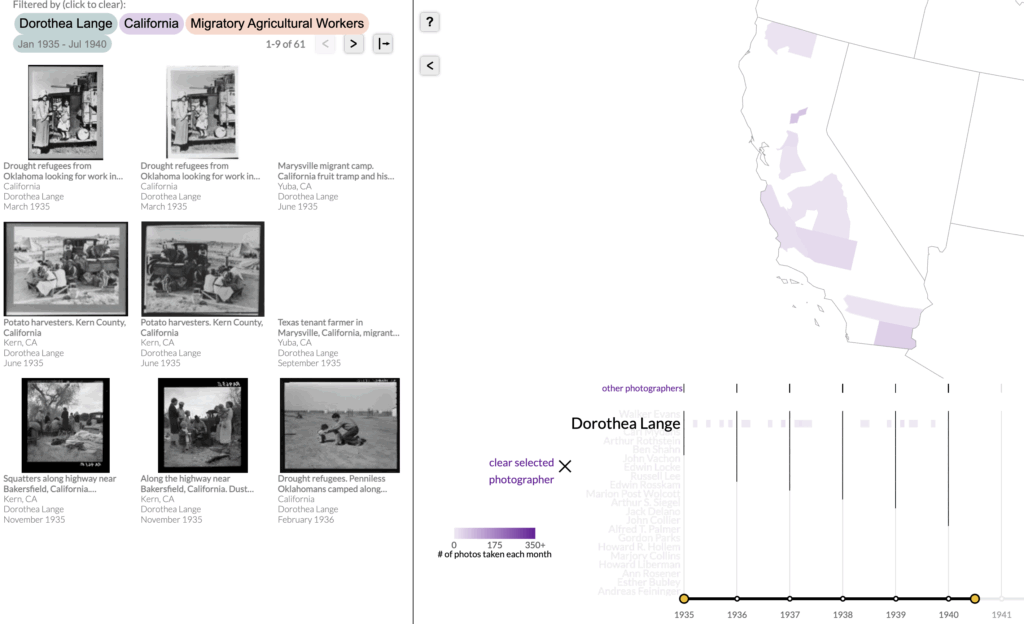
One of the strengths of the platform is the ability for users to filter their searches and having those filters reflected on the map. A user could easily filter for photos of migratory farm workers taken by Dorothea Lange in California and the photo archive would display the relevant images and where they were taken on the map, visualizing where Lange travelled and found her photo subjects. This type of visualization allows users to see at a glance when and where photographs were taken without having to delve into Library of Congress catalog metadata. The map illustrates where photographers were active and when, and it allows users to trace their journey across the country with the combination of the map and timeline.
An example of a heavily filtered search
The site is heavily reliant on the Library of Congress system as that is where the physical collection is housed. Every image included in the collection has a link to take the user to its Library of Congress page. One thing to note is that the metadata associated with the collection to aid in searching is based on the original 1942 classification system used by the FWA-OWI. These terms may not be the most intuitive and are some are far from natural language most people may use to search. There is also an obvious typo for a large category of images, the searchable phrase is “premanent homes” rather than permanent homes. These types of quibbles with the tagging system can present problems if a user doesn’t know the exact term of what they want to look for.
The search function for captions suffers from similar problems. Other quibbles include how users must navigate between the map and theme page before any map visualization was seen. The timeline works well except for a glitch when filtering between January and April 1935. Additionally, there are some limits to filtering, as only one theme can be searched at a time with no way to search multiple themes at once. This can be frustrating, especially as photographs can be separated into different themes even though they may have similar subject matter.
There is no clearly defined audience for this project, rather it is for anyone looking to understand more about Great Depression era America through primary source photos. I can see Photogrammar being useful for historians, but also as a valuable tool for classrooms. The organization of the site allows for beginners to find images right away through the landing page or the map while more advanced users can construct filtered visualizations and searches. One purpose of the project is to make the FWA-OWI photo collection more accessible, and it excels in this goal.
Overall, Photogrammar is an excellent way for anyone to explore the enormous archive of the FWA-OWI photographs in an engaging and easily accessible way. The site allows for multiple points of entry into the photo collection with its main strength being the map to visualize the photographs geospatially. While there are some problems that stem from the dated tagging system used and other filtering features, the site is a marvel in the way it allows users to quickly sort and find photos with the combination of the map and filters. Photogrammar works best as a discovery tool, allowing users to easily connect with the past and helping them visually understand the scope and scale of the FWA-OWI photo project and the impact the Great Depression had on the nation.
Photogrammar. https://photogrammar.org/maps Created by Lauren Tilton, Taylor Arnold, Nathanial Ayers, Justin Madron, Rob Nelson, and Laura Wexler and maintained by Univeristy of Richmond’s Digital Scholarship Lab and Distant Viewing Lab. https://photogrammar.org/about. Reviewed Septmeber 20 -October 2, 2025.
When it comes to digital historians, Dan Cohen is one of the giants of the field. Cohen has been an early scholar of the field, embracing and developing the field since the early 2000s. Over the length of his illustrious career, he’s served as the director for the Roy Rosenzweig Center for History and New Media and founded and served as executive director of the Digital Public Library of America.
Initially, Cohen started out as a religious historian, primarily studying the relationship between American Christianity and mathematics as he worked his way through the Ivy Leagues, getting his B.A in Religion from Princeton in 1990, his M.T.S from Harvard in 1992, and his M.Phil. and Ph.D in History from Yale in 1995 and 1999 respectively.
In the early, 2000s Cohen pivoted hard. Always interested in the history of science and technology, he began to pursue digital humanities and quickly became a pioneer in the field, specializing in promoting digital tools for historical use and creating digital archives and libraries. This culminated in the foundation of the Digital Public Library of America, a digital repository for materials from institutions across the county with the intent of making them easily accessible online. Cohen is also a professor of history, first at George Mason University from 2008 to 2013 and since 2017 is a professor of history and dean of the library at Northeastern University.
Cohen embraced social media as a tool for historians, but nowadays has a more modest presence online. He has run a history blog since 2005 and joined Twitter in 2008. Prior to 2022, Cohen was fairly active on social media, mainly Twitter. It was mostly used as a platform to promote his own work and share history articles, but he also used it for personal use, sharing what was going on in his life and a lot of pictures of his dog. He’s pretty popular too, with nearly 18,000 followers.
One of many, many posts Dan Cohen has made about his dog.
After 2023, Cohen’s Twitter presence almost vanishes, with only a few posts made between October 2023 and now. Cohen has still been blogging throughout this time but just doesn’t use the mainstream platforms anymore. He himself admits uses Threads and X “but [he goes] there as often, and as enthusiastically, as the dentist.” I can’t say I blame him.
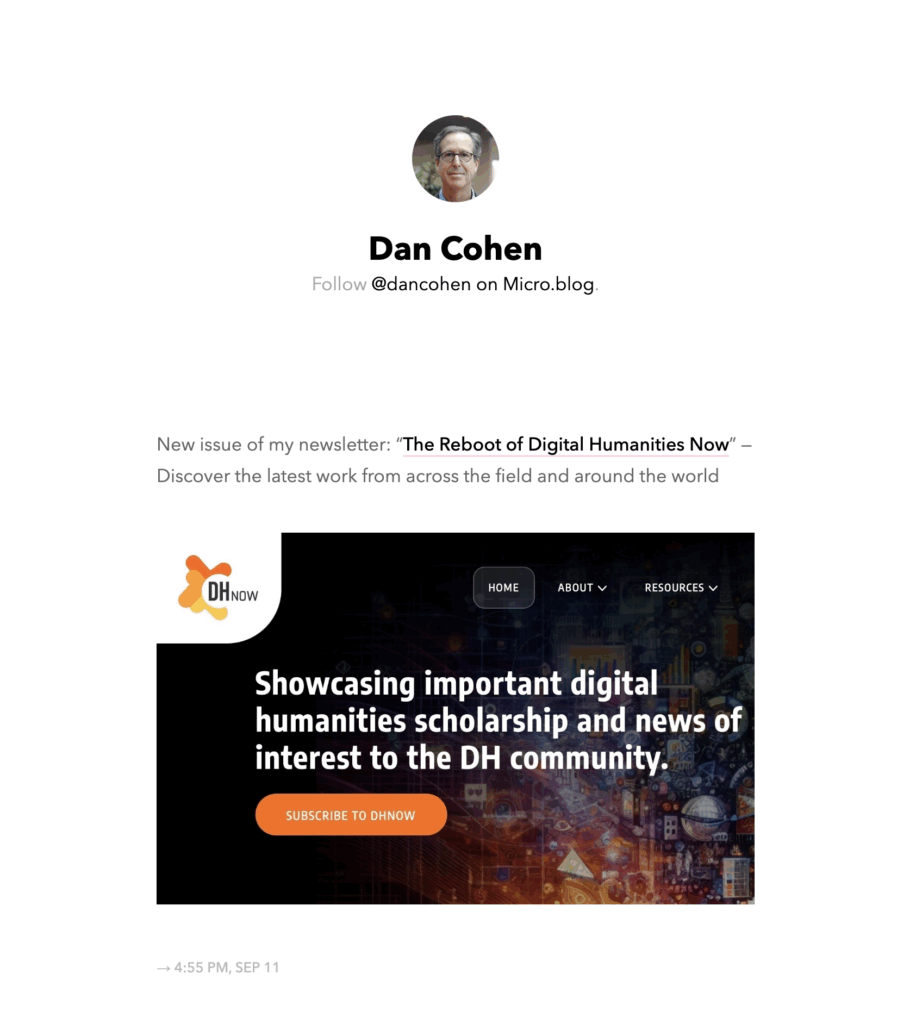
Cohen’s Microblog feed
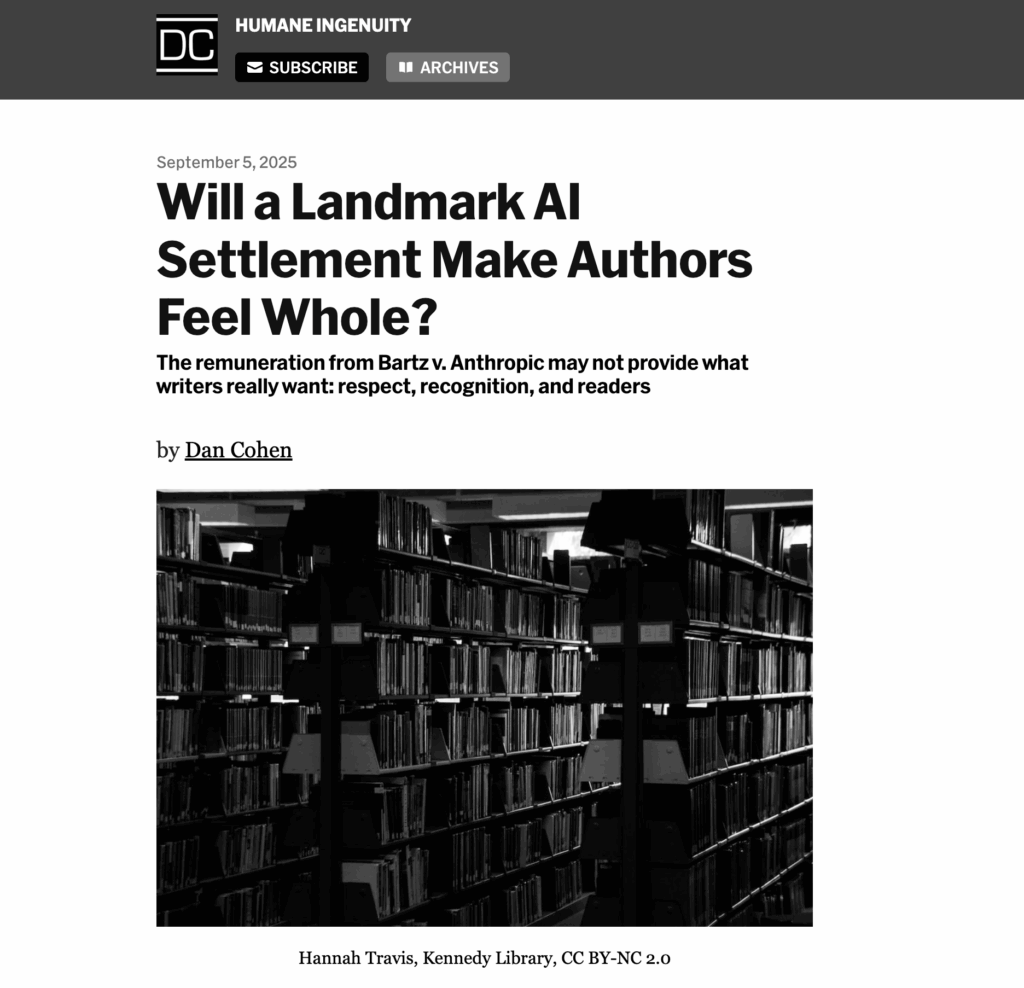
Instead, Cohen posts primarily from Microblog. Microblog also has a function that allows for Bluesky posts to show up in the main feed which means posts from both sites can be viewed from just one feed. He uses this primarily for posting about his work and newsletter as well as linking articles relevant to the field of digital history. Cohen has sent out a digital newsletter called Humane Ingenuity since 2018 that focuses on the intersection of libraries, history, and emerging technology. As you can probably imagine, AI has become a focal point of these posts and articles in recent years. Cohen believes in the accessibility of knowledge, so this newsletter allows for a curious public to easily engage with his work and thoughts as the digital landscape continues to develop. Cohen is fairly apolitical with his online presence, instead preferring to have a very comprehensive approach with a professional base with a few personal touches. He will chime into debates surrounding digital libraries and AI, such as the recent court case of Bartz v. Anthropic, which deals with if using books to train AI constitutes as fair use.
A recent article from Dan Cohen’s newsletter
Overall, Cohen maintains a steady, professional image online even if it’s away from more mainstream social platforms like Twitter. Cohen, as a digital historian, has embraced online platforms for history illustrated by his blog and newsletter and has maintained a professional, history centered approach on said platforms. Cohen’s online presence can be a good blueprint for those looking to have a more professional digital footprint and how to platform digital humanities.